Intuition#
K-Means is essentially about finding groups of points that are close together, and representing each group by a central point (centroid).
Think of it like this:
Imagine you are trying to place K warehouses in a city such that they minimize the average distance to customers.
Each customer will go to their nearest warehouse.
The warehouse positions are adjusted until they best serve the distribution of customers.
That’s exactly what K-Means does:
Warehouses → Centroids
Customers → Data Points
Distance → Euclidean Distance
Step-by-Step Intuition#
1. Random Initialization of Centroids#
Pick K random points (centroids).
At this stage, the centroids may not make sense, but it gives us a starting guess.
👉 Analogy: Placing warehouses randomly on a map before checking customer demand.
2. Assignment Step (E-Step)#
Each data point is assigned to the nearest centroid based on Euclidean distance.
This creates K groups (clusters).
👉 Customers pick the nearest warehouse.
3. Update Step (M-Step)#
Compute the mean of all points in each cluster.
Move the centroid to this new mean location.
👉 Warehouses move closer to the center of their customers.
4. Repeat#
Reassign points to the nearest centroid.
Update centroids again.
Continue until centroids stop moving significantly (convergence).
👉 Warehouses keep relocating until they are at the “best” spots.
5. Final Clusters#
Once centroids stabilize, we have our clusters.
Every point belongs to the cluster whose centroid it is closest to.
Key Intuition Insights#
Why mean?
Because minimizing squared Euclidean distances naturally pulls centroids toward the average location of their assigned points.
Why does it converge?
At every step, the algorithm reduces the total within-cluster variance (WCSS).
Since variance cannot decrease forever, the process stops.
Why Euclidean distance?
The mean is the minimizer of squared Euclidean distance.
That’s why we use Euclidean space, not cosine or Manhattan (unless adapted).
Why does K matter?
If K is too small → clusters are too broad, lose detail.
If K is too large → overfits, creates meaningless tiny clusters.
Visual Intuition#
Imagine dropping magnets (centroids) randomly in a field of iron filings (data points).
The filings move toward their nearest magnet.
The magnet shifts to the “center of mass” of filings around it.
Repeat → the magnets settle in stable positions, representing clusters.
In summary
K-Means clustering is about iteratively pulling centroids toward the center of their assigned points, until a stable grouping emerges that minimizes the total squared distance within clusters.
import numpy as np
import matplotlib.pyplot as plt
from sklearn.datasets import make_blobs
from sklearn.cluster import KMeans
# Generate synthetic 2D data (easy to visualize)
X, _ = make_blobs(n_samples=200, centers=4, cluster_std=0.8, random_state=42)
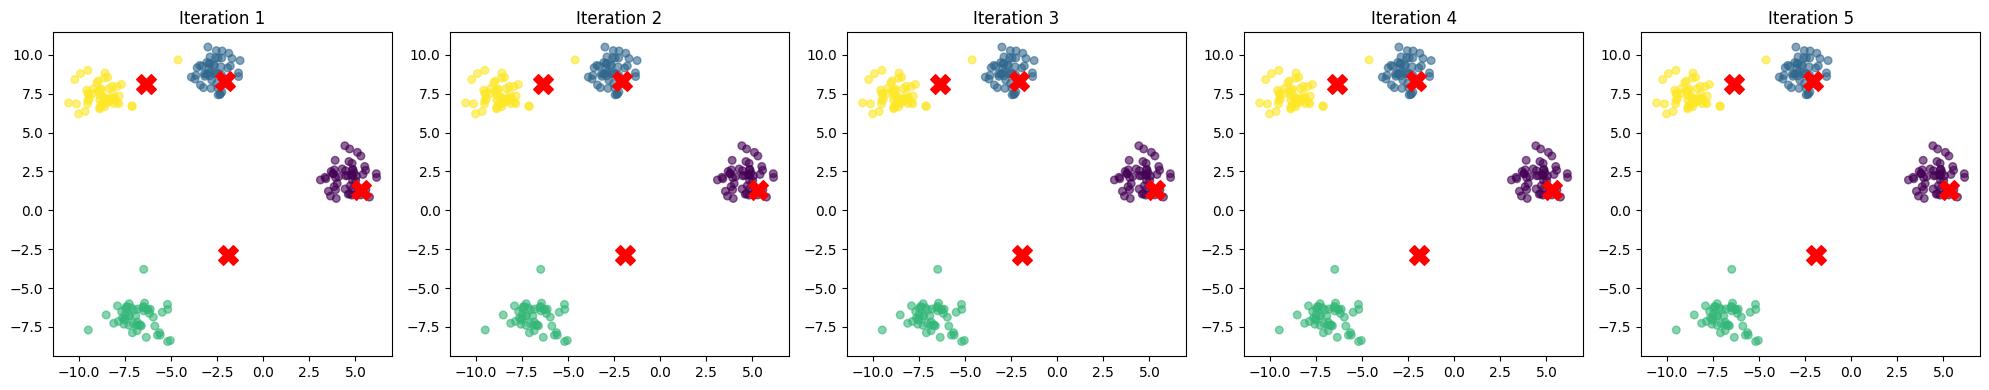
# Function to plot the clustering process step by step
def plot_kmeans_progress(X, K=4, max_iters=5):
# Initialize KMeans with limited iterations
kmeans = KMeans(n_clusters=K, init="random", n_init=1, max_iter=1, random_state=42)
fig, axes = plt.subplots(1, max_iters, figsize=(20, 4))
for i in range(max_iters):
kmeans.fit(X)
centroids = kmeans.cluster_centers_
labels = kmeans.labels_
axes[i].scatter(X[:,0], X[:,1], c=labels, cmap="viridis", s=30, alpha=0.6)
axes[i].scatter(centroids[:,0], centroids[:,1], c="red", marker="X", s=200)
axes[i].set_title(f"Iteration {i+1}")
plt.tight_layout()
plt.show()
# Demonstrate step-by-step centroid movement
plot_kmeans_progress(X, K=4, max_iters=5)