Hyperparameter Tuning in Decision Tree#
Hyperparameters are settings that control how the tree grows, rather than learned from the data.
Tuning means selecting the combination that gives the best performance on unseen data, usually validated with cross-validation.
Key Hyperparameters of Decision Tree#
Hyperparameter |
Description |
Effect |
|---|---|---|
|
Maximum depth of the tree |
Lower → underfitting, Higher → overfitting |
|
Min samples required to split a node |
Higher → simpler tree, Lower → complex tree |
|
Min samples required at a leaf |
Larger → smoother predictions |
|
Max features to consider for a split |
Reduces variance, increases bias |
|
Maximum number of leaves |
Restricts tree growth |
|
Split quality measure ( |
Determines how splits are chosen |
Goal: Balance between bias and variance to improve generalization.
2. Overfitting vs Underfitting#
Issue |
Description |
Symptoms |
How to Handle |
|---|---|---|---|
Overfitting |
Tree is too complex, memorizes training data |
Very high train score, low test score |
1. Reduce |
Underfitting |
Tree is too simple, cannot capture patterns |
Both train & test scores are low |
1. Increase |
3. Practical Steps for Hyperparameter Tuning#
Step 1: Identify the problem#
Check train vs test performance using metrics like R², RMSE, MAE.
Step 2: Tune hyperparameters#
Use GridSearchCV or RandomizedSearchCV to find optimal hyperparameters.
Example grid:
param_grid = {
    'max_depth': [None, 2, 3, 4, 5],
    'min_samples_split': [2, 3, 4, 5],
    'min_samples_leaf': [1, 2, 3]
}
Step 3: Validate using cross-validation#
Ensures hyperparameters generalize to unseen data.
Step 4: Evaluate#
Check train/test R², RMSE and ensure the gap is not too large (prevents overfitting).
4. Tips to Handle Overfitting/Underfitting#
Overfitting#
Limit tree depth:
max_depthSet minimum samples per leaf:
min_samples_leafSet minimum samples to split:
min_samples_splitLimit number of leaf nodes:
max_leaf_nodesUse ensemble methods like Random Forest or Gradient Boosting
Underfitting#
Increase tree depth
Reduce
min_samples_leaf/min_samples_splitAdd more features or interaction terms
Ensure data preprocessing is correct
5. Visual intuition#
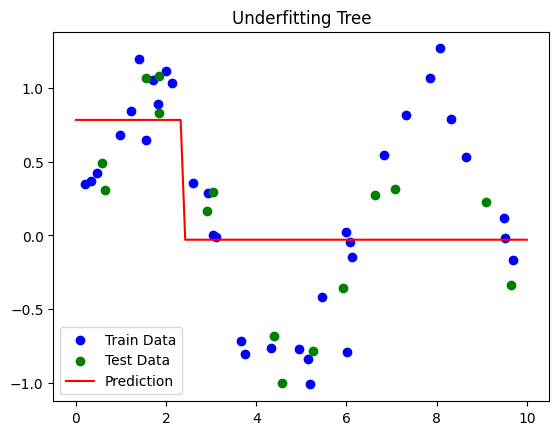
Shallow tree → Underfitting (misses patterns)
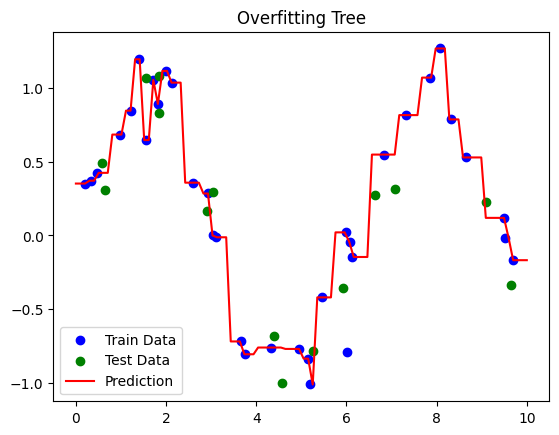
Deep tree → Overfitting (memorizes noise)
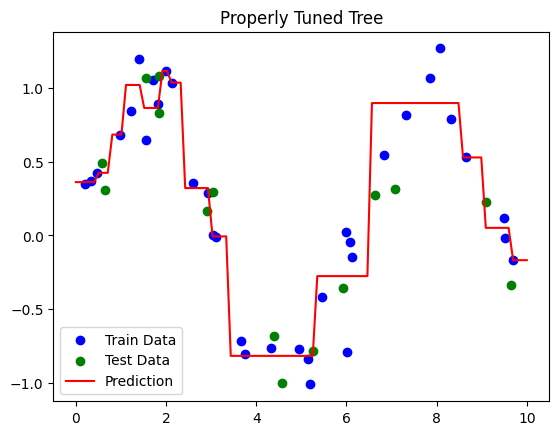
Properly tuned tree → Captures patterns, generalizes well
# Step 1: Import Libraries
import numpy as np
import pandas as pd
import matplotlib.pyplot as plt
from sklearn.model_selection import train_test_split, GridSearchCV
from sklearn.tree import DecisionTreeRegressor
from sklearn.metrics import mean_squared_error, r2_score

# Step 2: Create Sample Dataset
np.random.seed(42)
X = np.sort(np.random.rand(50, 1) * 10, axis=0)  # Features
y = np.sin(X).ravel() + np.random.normal(0, 0.2, X.shape[0])  # Target with noise

# Split Dataset
X_train, X_test, y_train, y_test = train_test_split(X, y, test_size=0.3, random_state=42)

# Function to train and evaluate a model
def evaluate_dtr(model, X_train, X_test, y_train, y_test, label="Model"):
    model.fit(X_train, y_train)
    y_train_pred = model.predict(X_train)
    y_test_pred = model.predict(X_test)

    print(f"\n{label} Performance:")
    print(f"Train R²: {r2_score(y_train, y_train_pred):.2f}")
    print(f"Test R²: {r2_score(y_test, y_test_pred):.2f}")

    # Plot
    plt.scatter(X_train, y_train, c='blue', label='Train Data')
    plt.scatter(X_test, y_test, c='green', label='Test Data')
    X_plot = np.linspace(0, 10, 100).reshape(-1,1)
    plt.plot(X_plot, model.predict(X_plot), c='red', label='Prediction')
    plt.title(label)
    plt.legend()
    plt.show()

# ----------------------
# Underfitting Example
# ----------------------
dtr_underfit = DecisionTreeRegressor(max_depth=1, random_state=42)
evaluate_dtr(dtr_underfit, X_train, X_test, y_train, y_test, label="Underfitting Tree")

# ----------------------
# Overfitting Example
# ----------------------
dtr_overfit = DecisionTreeRegressor(max_depth=None, min_samples_leaf=1, random_state=42)
evaluate_dtr(dtr_overfit, X_train, X_test, y_train, y_test, label="Overfitting Tree")

# ----------------------
# Properly Tuned Tree using GridSearchCV
# ----------------------
param_grid = {
    'max_depth': [2, 3, 4, 5, 6],
    'min_samples_split': [2, 3, 4],
    'min_samples_leaf': [1, 2, 3]
}

grid_search = GridSearchCV(DecisionTreeRegressor(random_state=42),
                           param_grid, cv=3, scoring='r2')
grid_search.fit(X_train, y_train)
best_dtr = grid_search.best_estimator_
evaluate_dtr(best_dtr, X_train, X_test, y_train, y_test, label="Properly Tuned Tree")
Underfitting Tree Performance:
Train R²: 0.32
Test R²: 0.47
Overfitting Tree Performance:
Train R²: 1.00
Test R²: 0.87
Properly Tuned Tree Performance:
Train R²: 0.94
Test R²: 0.82
The Kernel crashed while executing code in the current cell or a previous cell.

Please review the code in the cell(s) to identify a possible cause of the failure.

Click <a href='https://aka.ms/vscodeJupyterKernelCrash'>here</a> for more info.

View Jupyter <a href='command:jupyter.viewOutput'>log</a> for further details.
Interpretation#
Dataset:
\(y = \sin(X) + \text{noise}\) → nonlinear pattern with randomness.
Underfitting Tree:
Very shallow (
max_depth=1) → misses the sine pattern.Low train and test R².
Overfitting Tree:
Grows fully (
max_depth=None,min_samples_leaf=1) → memorizes training data.High train R², low test R².
Properly Tuned Tree:
GridSearchCV finds optimal
max_depth,min_samples_split,min_samples_leaf.Balances bias and variance → good train/test R².