Hyperparameter Tuning#
\(\epsilon\) (eps): neighborhood radius.
minPts: minimum number of points required to form a dense cluster.
2. Hyperparameter Tuning#
Choosing \(\epsilon\)#
Too small → many points become noise, clusters fragmented (underfitting).
Too large → different clusters merge (overfitting, loss of structure).
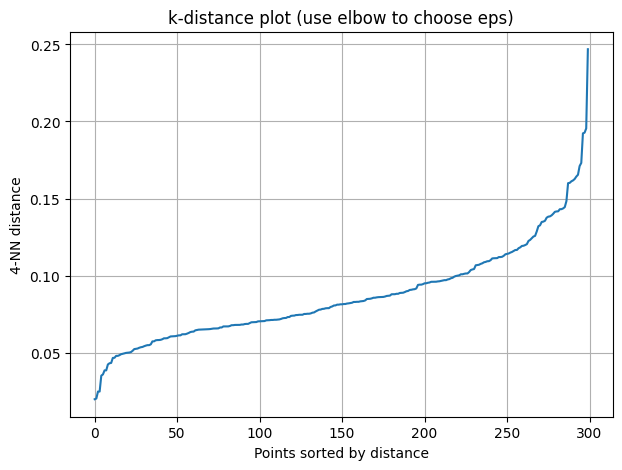
Method: k-distance graph
Compute distance of each point to its \(k\)-th nearest neighbor (\(k = \text{minPts}\)).
Sort these distances.
Look for an “elbow” (sharp change). That distance is a good \(\epsilon\).
Choosing minPts#
Rule of thumb: \(\text{minPts} \geq d+1\), where \(d\) = data dimension.
Larger datasets: minPts ~ log(n).
Smaller minPts → risk of tiny spurious clusters.
Larger minPts → risk of treating small real clusters as noise.
3. Overfitting vs Underfitting in DBSCAN#
Overfitting (too many small clusters, fragmented)
Caused by very small \(\epsilon\), small minPts.
Symptoms: many clusters, many outliers.
Fix: increase \(\epsilon\) or minPts.
Underfitting (too few clusters, merged into one)
Caused by large \(\epsilon\), large minPts.
Symptoms: dataset collapses into 1 cluster or most points noise.
Fix: decrease \(\epsilon\) or minPts.
4. Practical Tuning Workflow#
Standardize data (DBSCAN is distance-based).
Use k-distance plot to select \(\epsilon\).
Choose minPts ≈ dimensionality × 2 (or log(n)).
Run DBSCAN, check metrics (Silhouette, Davies–Bouldin, ARI).
Adjust iteratively.
5. Alternatives when DBSCAN fails#
HDBSCAN: extension that adapts to clusters with varying densities.
OPTICS: similar but avoids picking a fixed \(\epsilon\).
import numpy as np
import matplotlib.pyplot as plt
from sklearn.datasets import make_moons
from sklearn.neighbors import NearestNeighbors

# Generate data
X, _ = make_moons(n_samples=300, noise=0.08, random_state=42)

# Compute k-nearest neighbors distances (k = 4, as minPts rule of thumb for 2D)
k = 4
nbrs = NearestNeighbors(n_neighbors=k).fit(X)
distances, indices = nbrs.kneighbors(X)

# Take the k-th nearest neighbor distance for each point
k_distances = np.sort(distances[:, k-1])

# Plot k-distance graph to find epsilon "elbow"
plt.figure(figsize=(7,5))
plt.plot(k_distances)
plt.ylabel(f"{k}-NN distance")
plt.xlabel("Points sorted by distance")
plt.title("k-distance plot (use elbow to choose eps)")
plt.grid(True)
plt.show()