Silhouette Clustering#
Silhouette is a metric to evaluate how well your clustering has performed. It doesn’t create clusters itself, but measures the quality of clusters obtained by a clustering algorithm (like K-Means, DBSCAN, etc.).
It answers two questions for each data point:
How close is this point to its own cluster? (cohesion)
How far is this point from other clusters? (separation)
A high silhouette score → the point is well matched to its cluster and poorly matched to others.
2. Mathematical Definition#
For a data point \(i\):
\(a(i)\) = average distance of \(i\) to all other points in its own cluster
\(b(i)\) = minimum average distance of \(i\) to points in any other cluster (the closest cluster that i is not in)
The silhouette score \(s(i)\) for the point \(i\) is:
\(s(i)\) ranges from -1 to 1:
Close to 1 → well-clustered
Around 0 → on the boundary between clusters
Negative → may be in the wrong cluster
The average silhouette score over all points is used to measure overall clustering quality.
3. Intuition#
If \(a(i) \ll b(i)\) → point is closer to its cluster than others → good clustering.
If \(a(i) \approx b(i)\) → point is on the boundary.
If \(a(i) > b(i)\) → point may be misclassified.
4. Workflow#
Perform clustering (e.g., K-Means, DBSCAN, Agglomerative).
Compute silhouette score for each data point.
Compute average silhouette score to evaluate the clustering.
Optionally, plot silhouette values for all clusters to visually inspect cluster quality.
5. Python Example (K-Means)#
import matplotlib.pyplot as plt
from sklearn.datasets import make_blobs
from sklearn.cluster import KMeans
from sklearn.metrics import silhouette_score, silhouette_samples
import numpy as np

# Generate synthetic data
X, y = make_blobs(n_samples=300, centers=3, cluster_std=1.0, random_state=42)

# Fit K-Means
kmeans = KMeans(n_clusters=3, random_state=42)
labels = kmeans.fit_predict(X)

# Silhouette score
avg_score = silhouette_score(X, labels)
print("Average Silhouette Score:", avg_score)

# Silhouette values per sample
sil_values = silhouette_samples(X, labels)

# Plotting silhouette
plt.figure(figsize=(8, 5))
y_lower = 0
for i in range(3):
    cluster_sil = sil_values[labels == i]
    cluster_sil.sort()
    y_upper = y_lower + len(cluster_sil)
    plt.fill_betweenx(np.arange(y_lower, y_upper), 0, cluster_sil, alpha=0.7)
    plt.text(-0.05, y_lower + 0.5*len(cluster_sil), str(i))
    y_lower = y_upper + 10
plt.xlabel("Silhouette coefficient")
plt.ylabel("Cluster")
plt.title("Silhouette plot for clusters")
plt.show()
Average Silhouette Score: 0.8480303059596955
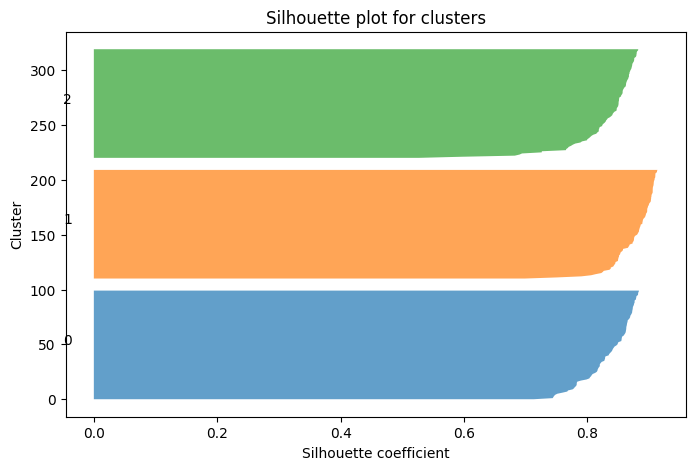
✅ Interpretation:
Each cluster gets a band of silhouette values.
Longer bands → better cohesion.
Short or negative values → misfit points.