Workflow#
(Agglomerative HC)
Step 1: Data Preprocessing#
Scale/normalize features so that all dimensions contribute equally (especially important if using Euclidean distance).
Handle missing values and outliers if possible, as HC is sensitive to noise.
Step 2: Compute Distance Matrix#
Calculate pairwise distances between all points.
Common metrics:
Euclidean distance (most common)
Manhattan distance
Cosine distance
Result is an n × n distance matrix (symmetric).
Step 3: Choose Linkage Criteria#
Decide how to measure distance between clusters:
Single linkage → minimum distance between points of clusters
Complete linkage → maximum distance between points of clusters
Average linkage → average distance between points of clusters
Ward’s method → merge clusters to minimize within-cluster variance
Choice of linkage affects the shape and size of clusters.
Step 4: Iterative Merging (Agglomerative)#
Start with each point as its own cluster.
Find the two closest clusters based on chosen linkage and merge them.
Update the distance matrix to reflect the merged cluster.
Repeat until all points are merged into a single cluster.
Step 5: Build Dendrogram#
Record merges at each step to create a tree-like structure.
Height of branches represents the distance at which clusters were merged.
Provides a visual summary of cluster hierarchy.
Step 6: Determine Number of Clusters#
Cut the dendrogram at a chosen height:
Clusters below the cut are considered separate clusters.
Can also use distance threshold or number of clusters criteria.
Step 7: Analyze and Interpret#
Visualize clusters in 2D/3D (after dimensionality reduction if necessary).
Examine dendrogram to understand nested structure of clusters.
Use clusters for exploratory analysis, pattern discovery, or further modeling.
Workflow Diagram (Conceptual)#
Data Preprocessing → standardization, outlier handling
Compute Distance Matrix → pairwise distances
Choose Linkage Method → single, complete, average, Ward
Iterative Merging → merge closest clusters
Build Dendrogram → tree showing merges
Cut Dendrogram → form clusters
Analysis & Interpretation → examine cluster structure
Intuition#
Think of each point as a leaf of a tree:
Merge closest leaves first → form branches → eventually form the root.
Cutting the tree at different heights gives different levels of clustering granularity.
import numpy as np
import matplotlib.pyplot as plt
from scipy.cluster.hierarchy import dendrogram, linkage
from sklearn.datasets import make_blobs
# Step 1: Generate synthetic dataset
X, y = make_blobs(n_samples=20, centers=3, n_features=2, random_state=42)
# Step 2: Compute linkage matrix using Ward's method
Z = linkage(X, method='ward')
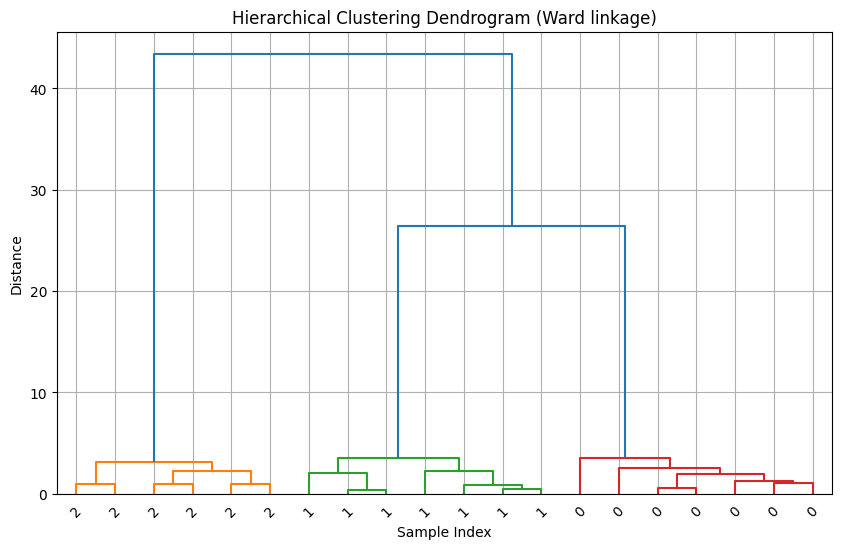
# Step 3: Plot dendrogram
plt.figure(figsize=(10, 6))
dendrogram(Z, labels=y, leaf_rotation=45, leaf_font_size=10, color_threshold=10)
plt.title("Hierarchical Clustering Dendrogram (Ward linkage)")
plt.xlabel("Sample Index")
plt.ylabel("Distance")
plt.grid(True)
plt.show()
import numpy as np
import matplotlib.pyplot as plt
from sklearn.datasets import make_blobs
from sklearn.cluster import KMeans
from scipy.cluster.hierarchy import dendrogram
# Generate synthetic dataset
X, y = make_blobs(n_samples=20, centers=3, n_features=2, random_state=42)
# Recursive divisive clustering function
def divisive_clustering(X, labels=None, cluster_id=0, dendro=None, parent=-1):
if labels is None:
labels = np.zeros(len(X))
if dendro is None:
dendro = []
# Stopping criterion: cluster size = 1
if len(X) <= 1:
return labels, dendro
# Split using KMeans with k=2
kmeans = KMeans(n_clusters=2, random_state=42)
cluster_labels = kmeans.fit_predict(X)
# Record split in dendrogram: parent, child, distance (use max distance in cluster)
dist = np.max(np.linalg.norm(X - kmeans.cluster_centers_[cluster_labels], axis=1))
dendro.append([parent, cluster_id, dist, len(X)])
# Recursively split each sub-cluster
for sub_label in [0, 1]:
sub_indices = np.where(cluster_labels == sub_label)[0]
if len(sub_indices) > 0:
labels[sub_indices], dendro = divisive_clustering(X[sub_indices], labels[sub_indices],
cluster_id+1, dendro, cluster_id)
return labels, dendro
# Run divisive clustering
labels, dendro = divisive_clustering(X)
# Convert dendro to array for plotting
dendro = np.array(dendro)
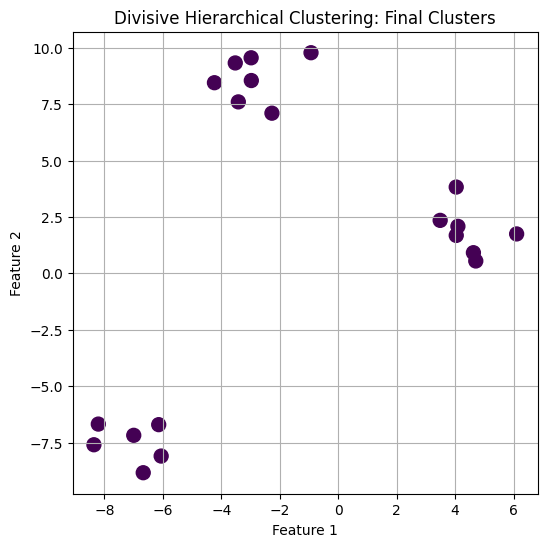
# Plot synthetic dataset with final labels
plt.figure(figsize=(6, 6))
plt.scatter(X[:, 0], X[:, 1], c=labels, cmap='viridis', s=100)
plt.title("Divisive Hierarchical Clustering: Final Clusters")
plt.xlabel("Feature 1")
plt.ylabel("Feature 2")
plt.grid(True)
plt.show()