Out-of-Bag (OOB) Evaluation#
In Random Forest, each tree is trained on a bootstrapped sample of the training data.
Bootstrapped sample: Randomly drawn with replacement → some observations appear multiple times, some don’t appear at all.
The observations not included in a tree’s training set are called Out-of-Bag (OOB) samples for that tree.
Intuition:
These OOB samples act as a validation set for that specific tree.
We can use them to estimate prediction error without a separate validation set.
2. How OOB Evaluation Works#
Build a Random Forest with
n_estimatorstrees.For each tree, identify its OOB samples.
Predict the OOB samples using that tree.
For each observation in the training set:
Average predictions from all trees where this observation was OOB.
Compare the averaged prediction to the true value → gives OOB error estimate.
3. Advantages of OOB Evaluation#
Advantage |
Explanation |
|---|---|
No separate validation set needed |
Uses unused samples from bootstrapping to estimate error |
Unbiased error estimate |
Each observation is tested only on trees that didn’t see it during training |
Efficient |
Saves time and data (especially with small datasets) |
Feature importance calculation |
Can be computed using OOB predictions |
4. OOB in Regression vs Classification#
Regression:
OOB error = Mean Squared Error (MSE) or R² of OOB predictions vs actual values.
Classification:
OOB error = Fraction of misclassified OOB samples → similar to test accuracy.
5. Example Intuition#
Suppose we have 10 training samples and build a tree with a bootstrapped sample of size 10.
Random sampling may pick:
[1, 2, 2, 3, 4, 5, 6, 7, 7, 8]OOB samples:
[9, 10](not picked in this tree)These two samples are used to validate this tree.
Repeat for all trees → average predictions for each sample where it was OOB → overall OOB error.
6. How to Enable OOB in Scikit-Learn#
from sklearn.ensemble import RandomForestRegressor

rf = RandomForestRegressor(n_estimators=100, oob_score=True, random_state=42)
rf.fit(X_train, y_train)

print("OOB R² score:", rf.oob_score_)
Note:
oob_score_gives R² for regression or accuracy for classification using OOB samples.Useful for quick evaluation without a separate validation set.
Key Takeaways
OOB evaluation is a built-in cross-validation mechanism for Random Forest.
Provides unbiased estimate of model performance.
Reduces the need for extra validation splits, especially for small datasets.
Works for both regression and classification.
# Step 1: Import Libraries
import numpy as np
import matplotlib.pyplot as plt
from sklearn.ensemble import RandomForestRegressor
from sklearn.model_selection import train_test_split
from sklearn.metrics import r2_score, mean_squared_error
# Step 2: Create Sample Dataset
np.random.seed(42)
X = np.sort(np.random.rand(100, 1) * 10, axis=0)
y = np.sin(X).ravel() + np.random.normal(0, 0.3, X.shape[0])
# Split into train and test set
X_train, X_test, y_train, y_test = train_test_split(X, y, test_size=0.3, random_state=42)
# Step 3: Train Random Forest with OOB enabled
rf = RandomForestRegressor(n_estimators=100, oob_score=True, random_state=42)
rf.fit(X_train, y_train)
# Step 4: OOB predictions
oob_r2 = rf.oob_score_
y_pred_test = rf.predict(X_test)
test_r2 = r2_score(y_test, y_pred_test)
print(f"OOB R² Score: {oob_r2:.2f}")
print(f"Test Set R² Score: {test_r2:.2f}")
# Step 5: Plot OOB vs Actual
# Note: Scikit-learn doesn't provide direct OOB predictions array easily, so we'll visualize test predictions
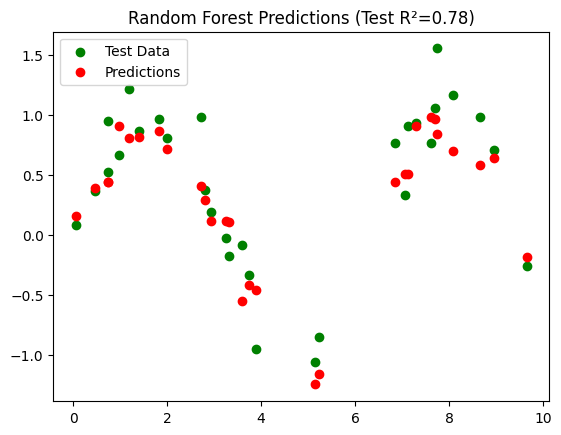
plt.scatter(X_test, y_test, color='green', label='Test Data')
plt.scatter(X_test, y_pred_test, color='red', label='Predictions')
plt.title(f"Random Forest Predictions (Test R²={test_r2:.2f})")
plt.legend()
plt.show()
OOB R² Score: 0.70
Test Set R² Score: 0.78
Interpretation#
Dataset: \(y = \sin(X) + \text{noise}\), nonlinear regression problem.
Random Forest:
n_estimators=100→ 100 treesoob_score=True→ enables OOB evaluation
OOB R²:
Computed using samples not seen by each tree during training
Provides an unbiased estimate of model performance
Test R²:
Computed on a separate test set for comparison
Visualization:
Shows predicted vs actual values on the test set
Key Takeaways
OOB evaluation is like built-in cross-validation.
Often, OOB R² is close to test set R², validating the model without splitting data further.
Very useful when data is limited or you want a quick performance check.