Hyperparameter Tuning#
Hierarchical clustering has fewer hyperparameters compared to algorithms like K-Means, but they still critically influence the clustering outcome:
Linkage Criteria (
linkage):Defines how the distance between clusters is computed.
Common options:
single: Distance between the closest points of clusters (can create “chaining effect”).complete: Distance between the farthest points (tends to produce compact clusters).average: Average distance between all points in clusters.ward: Minimizes variance within clusters (requires Euclidean distance).
Impact: Different linkage choices lead to different dendrogram structures and cluster assignments.
Distance Metric (
metric):Determines how the distance between points is computed.
Options include
euclidean,manhattan,cosine, etc.Impact: Changing the distance metric changes the shape and size of clusters. For example,
cosineis better for text embeddings.
Number of Clusters (
n_clusters) or Cut-off Threshold:Hierarchical clustering produces a dendrogram; you can cut it at a certain height to get clusters.
Options:
Predefine number of clusters:
n_clusters=3Use a distance threshold:
distance_threshold=h
Impact: The number of clusters can drastically change the interpretation.
Hyperparameter Tuning Workflow#
Unlike K-Means or supervised models, hierarchical clustering has no gradient or cost function to minimize directly. Instead, tuning relies on cluster evaluation metrics:
Step-by-step:
Choose a distance metric and linkage method:
Start with common choices like
ward+euclidean.Optionally, try
averageorcompleteif data has irregular shapes.
Build dendrogram:
Visualize cluster formation.
Helps identify natural cut points in the hierarchy.
Decide on number of clusters:
Cut dendrogram manually (by distance threshold) or set a fixed number.
Evaluate clusters using metrics:
If labels are available (supervised evaluation):
Adjusted Rand Index (ARI)
Normalized Mutual Information (NMI)
If labels are unavailable (unsupervised evaluation):
Silhouette Score
Davies-Bouldin Index
Calinski-Harabasz Index
Iterate:
Try different combinations of
linkage,metric, anddistance threshold.Select combination with the best evaluation score.
3. Practical Tips#
Ward linkage is generally preferred for numerical data because it minimizes intra-cluster variance.
Single linkage can lead to elongated clusters (“chaining effect”).
Use Silhouette Score when labels are unavailable to guide hyperparameter choice.
Avoid overly large numbers of clusters; hierarchical clustering can overfit noise if cut too low.
Summary:
Hyperparameters: linkage method, distance metric, number of clusters (or cut-off height).
Tuning approach: grid search + evaluation metrics (Silhouette, Davies-Bouldin).
Visualization: dendrograms are crucial for intuition and confirming cluster choice.
from sklearn.cluster import AgglomerativeClustering
from sklearn.metrics import silhouette_score
from sklearn.datasets import make_blobs
import numpy as np
import matplotlib.pyplot as plt
# Example hyperparameter grid
linkages = ['ward', 'complete', 'average']
metrics = ['euclidean', 'manhattan']
best_score = -1
best_params = {}
X, y_true = make_blobs(n_samples=200, centers=3, cluster_std=1.0, random_state=42)
for linkage in linkages:
for metric in metrics:
# Ward requires euclidean
if linkage == 'ward' and metric != 'euclidean':
continue
model = AgglomerativeClustering(n_clusters=3, linkage=linkage, metric=metric)
labels = model.fit_predict(X)
score = silhouette_score(X, labels)
if score > best_score:
best_score = score
best_params = {'linkage': linkage, 'metric': metric}
print("Best Silhouette Score:", best_score)
print("Best Hyperparameters:", best_params)
# Apply best model
model = AgglomerativeClustering(n_clusters=3, linkage=best_params['linkage'], metric=best_params['metric'])
labels = model.fit_predict(X)
plt.scatter(X[:, 0], X[:, 1], c=labels, cmap='viridis', s=50)
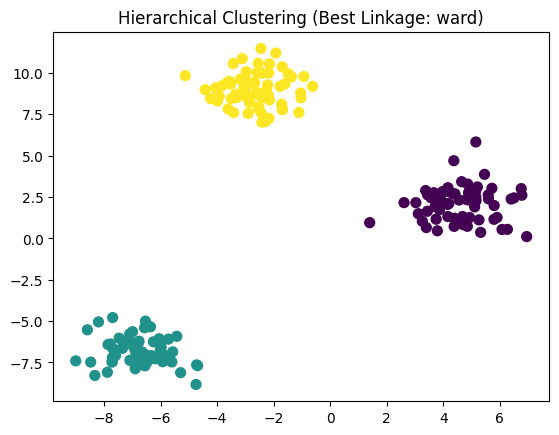
plt.title(f"Hierarchical Clustering (Best Linkage: {best_params['linkage']})")
plt.show()
Best Silhouette Score: 0.8467003894636074
Best Hyperparameters: {'linkage': 'ward', 'metric': 'euclidean'}