Assumptions#
Clusters are dense regions separated by sparse regions
DBSCAN assumes that true clusters have higher point density compared to noise and other clusters.
Noise points are isolated in low-density areas.
Distance metric meaningfully captures similarity
DBSCAN typically uses Euclidean distance.
Assumes that the chosen distance metric reflects closeness in the data space.
If features are on different scales, normalization is required.
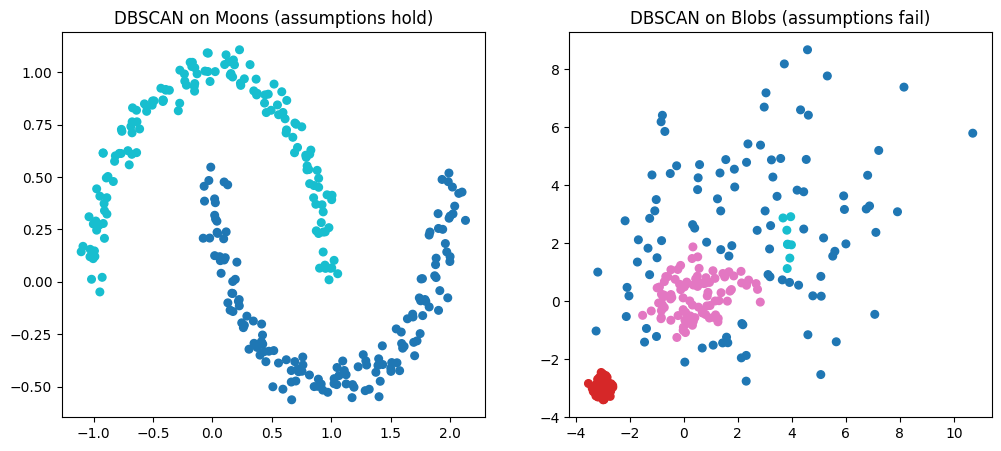
Global density parameters apply to all clusters
A single \(\epsilon\) (neighborhood radius) and
minPts(minimum points) are used for the whole dataset.Assumes all clusters have similar density.
Struggles if dataset contains clusters with widely varying densities.
Data lies in a metric space
The data should allow computation of distances that obey metric properties (non-negativity, identity, symmetry, triangle inequality).
Sufficient data density
For DBSCAN to identify meaningful clusters, enough points must exist in each dense region.
Sparse data may lead to many points being labeled as noise.
import numpy as np
import matplotlib.pyplot as plt
from sklearn.datasets import make_moons, make_blobs
from sklearn.cluster import DBSCAN

# Generate datasets
X1, _ = make_moons(n_samples=300, noise=0.05, random_state=42)  # Arbitrary shape, good for DBSCAN
X2, _ = make_blobs(n_samples=300, centers=[(-3, -3), (0, 0), (3, 3)], cluster_std=[0.2, 1.0, 2.5], random_state=42)  # Varying densities

# Apply DBSCAN
db1 = DBSCAN(eps=0.3, min_samples=5).fit(X1)
labels1 = db1.labels_

db2 = DBSCAN(eps=0.5, min_samples=5).fit(X2)
labels2 = db2.labels_

# Plotting
fig, axs = plt.subplots(1, 2, figsize=(12, 5))

# Subplot 1: moons dataset
axs[0].scatter(X1[:, 0], X1[:, 1], c=labels1, cmap="tab10", s=30)
axs[0].set_title("DBSCAN on Moons (assumptions hold)")

# Subplot 2: blobs with varying density
axs[1].scatter(X2[:, 0], X2[:, 1], c=labels2, cmap="tab10", s=30)
axs[1].set_title("DBSCAN on Blobs (assumptions fail)")

plt.show()