Decision Tree Classifier#
A Decision Tree Classifier is a supervised machine learning algorithm used for classification tasks. It works like a flowchart of decisions:
Root Node → the first feature used for splitting the dataset.
Internal Nodes → represent conditions/questions on features.
Branches → possible outcomes of a condition.
Leaf Nodes → final decision (class label).
👉 Example: If we want to predict whether someone will buy a product:
Root: Age ≤ 30?
Yes → Student?
Yes → Buy = Yes
No → Buy = No
No → Income ≤ 50k?
Yes → Buy = No
No → Buy = Yes
How does it decide splits?#
At each step, the tree selects the best feature to split data by measuring purity. Two main criteria:
Gini Impurity (default in scikit-learn)
\[ Gini = 1 - \sum (p_i^2) \]Lower Gini → purer node.
Entropy (Information Gain)
\[ Entropy = -\sum (p_i \log_2 p_i) \]A pure node has Entropy = 0.
Information Gain = Parent Entropy − Weighted Average Child Entropy.
Key Steps in Building a Decision Tree#
Start at the root node with all data.
Choose the best feature to split using Gini/Entropy.
Recursively split child nodes until:
All samples in a node belong to one class (pure).
Or stopping criteria (max depth, min samples, etc.) are met.
Assign leaf nodes with majority class.
Advantages
Easy to visualize & interpret (like a set of rules).
Handles both numerical & categorical data.
No feature scaling needed.
Disadvantages
Overfitting if tree is too deep.
Small changes in data may lead to a very different tree.
Bias toward features with more categories.
Use Cases
Medical diagnosis (disease classification).
Credit risk scoring.
Customer churn prediction.
Fraud detection.
import matplotlib.pyplot as plt
from sklearn.datasets import load_iris
from sklearn.tree import DecisionTreeClassifier, plot_tree
# Load dataset
iris = load_iris()
X, y = iris.data, iris.target
# Train Decision Tree Classifier
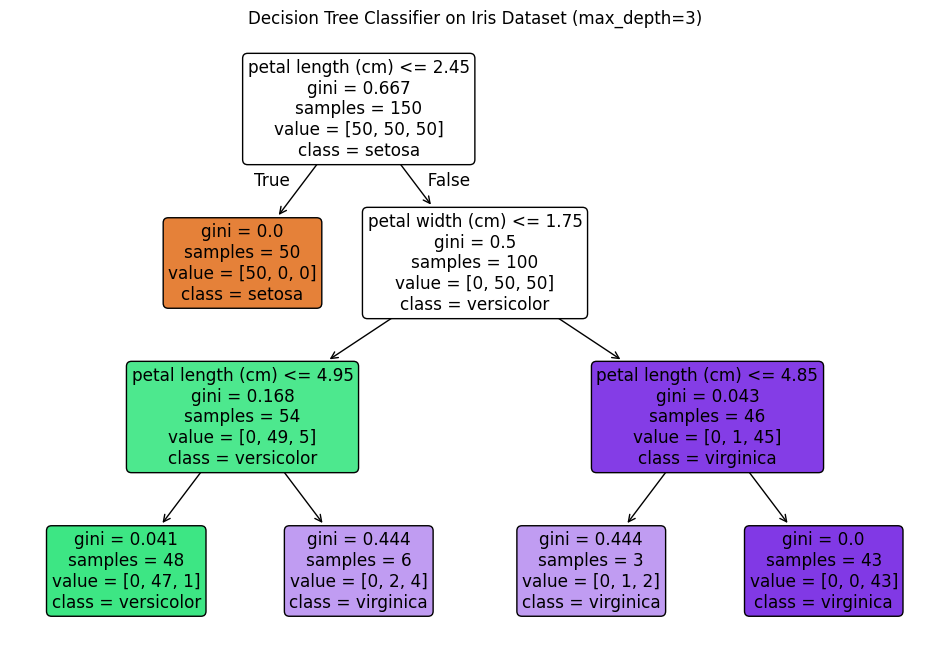
clf = DecisionTreeClassifier(criterion="gini", max_depth=3, random_state=42)
clf.fit(X, y)
# Plot decision tree
plt.figure(figsize=(12, 8))
plot_tree(clf, feature_names=iris.feature_names, class_names=iris.target_names, filled=True, rounded=True)
plt.title("Decision Tree Classifier on Iris Dataset (max_depth=3)")
plt.show()