AdaBoost Classifier#
AdaBoost (Adaptive Boosting) is an ensemble learning method that combines many weak classifiers (usually decision stumps = trees of depth 1) to build a strong classifier.
The key idea: Focus more on misclassified points in each round by adjusting sample weights.
Works well on tabular datasets, robust to overfitting if tuned properly.
How AdaBoost Classifier Works (Intuition)#
Start with equal weights
Each sample is given the same importance (weight = 1/N).
Train a weak learner
Example: a decision stump (one-split tree).
Find the split that minimizes classification error (weighted error).
Evaluate performance of weak learner
Weighted error:
\[ \epsilon = \frac{\sum w_i \cdot I(y_i \neq h(x_i))}{\sum w_i} \]If error > 0.5, the stump is discarded.
Assign weight to the weak learner
Performance score:
\[ \alpha = \frac{1}{2} \ln\left(\frac{1 - \epsilon}{\epsilon}\right) \]Better learners get higher α (more influence).
Update sample weights
Misclassified samples get higher weights → the next weak learner will focus more on them.
Correctly classified samples get lower weights.
Repeat steps 2–5 for multiple rounds.
Final prediction
Weighted majority vote of all weak learners:
\[ H(x) = \text{sign}\left(\sum_{m=1}^M \alpha_m \cdot h_m(x)\right) \]
Geometric Intuition#
Imagine a dataset that’s not perfectly separable with a line.
Each weak learner (stump) draws a simple vertical/horizontal split.
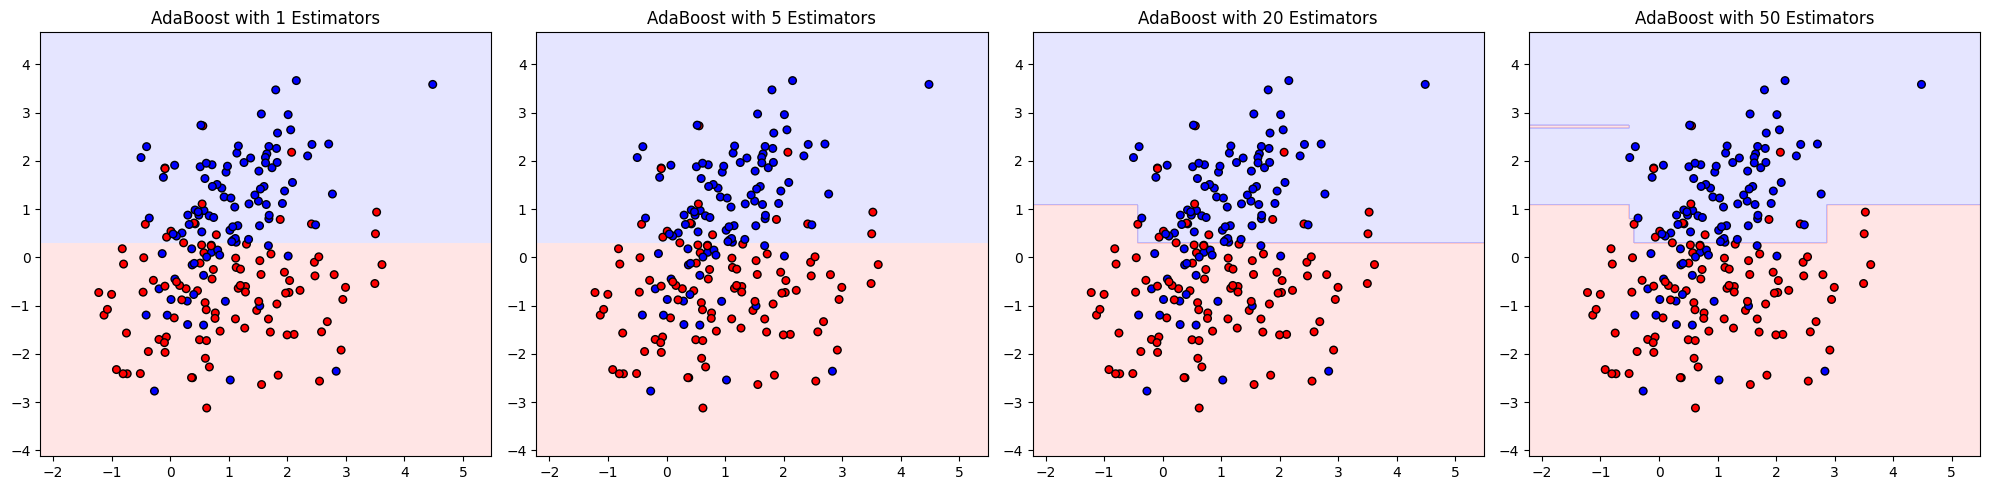
AdaBoost sequentially bends the decision boundary by combining stumps, correcting mistakes iteratively.
End result: a non-linear decision boundary that fits the dataset much better than any single stump.
Key Hyperparameters#
n_estimators→ number of weak learners (default 50).Too few → underfit.
Too many → risk overfit.
learning_rate→ shrinks each weak learner’s weight contribution.Low value (e.g., 0.1) → slower but more stable learning.
High value (e.g., 1.0) → faster but risk overfit.
estimator→ base model (default: DecisionTreeClassifier(max_depth=1)).Can increase depth for more complex patterns.
Performance Metrics#
Since it’s a classifier, evaluation uses:
Accuracy → overall correct predictions.
Precision, Recall, F1 → for imbalanced classes.
ROC-AUC → probability-based ranking of predictions.
Log Loss → penalizes overconfident wrong predictions.
Advantages#
✅ Works well with simple weak learners (stumps). ✅ Reduces bias significantly. ✅ Handles non-linear data. ✅ Robust against overfitting if tuned properly.
Limitations#
❌ Sensitive to noisy data & outliers (because they get high weights).
❌ Can be slower than Random Forest when n_estimators is large.
In short: AdaBoost Classifier = sequentially trained weak classifiers (stumps) + reweighting misclassified points → strong ensemble that produces non-linear decision boundaries.
import matplotlib.pyplot as plt
import numpy as np
from sklearn.datasets import make_classification
from sklearn.ensemble import AdaBoostClassifier
from sklearn.tree import DecisionTreeClassifier
from matplotlib.colors import ListedColormap

# Generate toy dataset (2 features for visualization)
X, y = make_classification(
    n_samples=200, n_features=2, n_redundant=0, n_informative=2,
    n_clusters_per_class=1, flip_y=0.1, random_state=42
)

# Create weak learner (Decision Stump)
stump = DecisionTreeClassifier(max_depth=1)

# Train AdaBoost with increasing estimators
estimators_list = [1, 5, 20, 50]
models = [AdaBoostClassifier(estimator=stump, n_estimators=n, random_state=42).fit(X, y)
          for n in estimators_list]

# Create mesh for decision boundary plotting
x_min, x_max = X[:, 0].min() - 1, X[:, 0].max() + 1
y_min, y_max = X[:, 1].min() - 1, X[:, 1].max() + 1
xx, yy = np.meshgrid(np.linspace(x_min, x_max, 300),
                     np.linspace(y_min, y_max, 300))

# Plot decision boundaries
fig, axes = plt.subplots(1, 4, figsize=(20, 5))

for ax, model, n in zip(axes, models, estimators_list):
    Z = model.predict(np.c_[xx.ravel(), yy.ravel()])
    Z = Z.reshape(xx.shape)

    ax.contourf(xx, yy, Z, alpha=0.3, cmap=ListedColormap(['#FFAAAA', '#AAAAFF']))
    ax.scatter(X[:, 0], X[:, 1], c=y, cmap=ListedColormap(['#FF0000', '#0000FF']), edgecolor="k", s=30)
    ax.set_title(f"AdaBoost with {n} Estimators")

plt.tight_layout()
plt.show()